26 SEPTEMBER 2018
The Power of X (and Y)

Mathematics is an integral part of scientific study, and one that students often find a barrier to progression in science. Students can find it difficult to apply maths knowledge to science scenarios, even if they have encountered the maths concept previously.
The Association for Science Education (ASE) is the largest subject association in the United Kingdom. The ASE Language of Mathematics in Science project provides extensive and detailed guidance on the use of mathematics for teachers of science 11-16. Since publication we have worked with many science teachers who still find students have problems with graphing, particularly when processing their own data collected in experiments. Graph interpretation and drawing are fundamental skills for learning science. But as science teachers we should be aware that there are subtle differences to the way graphs are treated in mathematics. By adopting some of the approaches mathematics teachers use, we can help our students achieve success with graphing in science.
Here I describe how to use two symbols, X and Y, to help students link the approach used in science back to their mathematics lessons and help them recognise connections between seemingly different activities.
The power of X (and Y)
1. Recording data in tables
A school science convention is to construct vertical tables for recording data with column headings. The first column naming the independent variable and indicating relevant units, followed by the dependent variable and units as the second column heading:
|
Independent variable name (units) Eg Time (s) |
Dependant variable name (units) Eg Distance (m) |
|
|
|
|
|
|
Using the X and Y labels, we can explain that X is before Y in the alphabet so the first column in a table is called ‘X’ and the second column is called ‘Y’. These labels are then used when creating tables until students are confident and familiar with using the terms X and Y to mean the independent and dependent variables.
|
X |
Y |
|
Independent variable name (units) Eg Time (s) |
Dependant variable name (units) Eg Distance (m) |
|
|
|
|
|
|
At this stage the use of X and Y may appear to be an unnecessary complication, but all will be revealed in the next two sections.
2. Constructing graph axes and marking coordinates
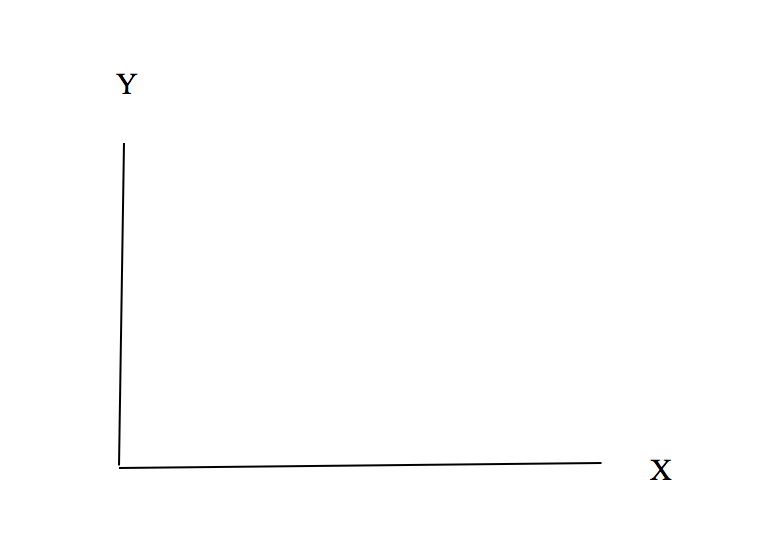
Name the horizontal axis ‘X’ and the vertical axis ‘Y instead of horizontal and vertical, as these words can cause some students problems if their grasp of language is weak. It then becomes clear “which way round the axes go” and students can choose the correct column of data when deciding which scale for which axis. To make it easier to decide on a scale it’s best to restrict the choice to one, two or five units, and their multiples of ten, per centimetre square.

The axes should then be labelled with the name and units of the independent variable (X) and dependent variable (Y).
When plotting coordinates, it helps students if we explain that values in the X column of the results table are marked along the X axis and likewise the value for Y on the Y axis.
3. Taking it further – gradients
In science we often derive data from the results of an experiment without direct measurement by calculating the gradient of a graph. An example would be using the gradient of a distance time graph to determine speed. It is unlikely that some students will have encountered this use of gradients in their mathematics lessons – we found that students can be surprised to discover for instance that gradients can have units.
In the list of mathematics skills that are included in English GCSE is:
‘Understand that y=mx+c represents a linear relationship’.
In this equation ‘m’ represents the gradient of a graph plotted for values of X and Y, and ‘c’ represents the intercept on the Y axis.
Many graphs in science have a line of best fit that passes through the origin, and so the value of ‘c’ is zero.
Rearranging the equation, if c=0,
y = mx
y = mx (divide both sides of the equation by x)
x x
y = m (cancel)
x
m = y (reverse)
x
This means that a change in the Y axis value divided by a corresponding change in X axis value gives the gradient of the graph. It allows us to derive useful information from graphs, which at this level in school science often means rates of change.

Using the example of distance against time, dividing a period of time (in s) into the distance travelled (in m) gives speed (in m/s). Using X and Y terminology has helped students to make links between the results table, graph labels and the equation describing the line of the graph (which is used in mathematics lessons). Note that including units in the calculation is a useful check to ensure these processes have been carried out correctly. Time (in s) divided into distance (in m) should give units of speed as m/s.
In summary, using X and Y vocabulary to describe aspects of tables, graphs and gradients has helped students make links between the mathematics they have been taught in mathematics lessons and that used in science. It also has helped students to make links between different areas of mathematics, so strengthening their understanding and accelerating their learning.
Reference
The Language of Mathematics in Science: A Guide for Teachers of 11-16 Science, Boohan, R., (2016) The Association for Science Education
GCSE subject content, Combined science, DfE, June 2015 available at https://assets.publishing.service.gov.uk/government/uploads/system/uploads/attachment_data/file/800339/Combined_science_GCSE_updated_May_2019.pdf
Coming soon
Maths Skills for Cambridge IGCSE® Biology, Chemistry and Physics write-in workbooks allow students to practise their maths skills in science contexts. These resources have been written in collaboration with the Association for Science Education (ASE), based on research carried out with the Nuffield Foundation. The accompanying teacher’s guides provide support for teachers to teach mathematical concepts in science lessons.
 |
 |
 |
Richard Needham is Trustee and Past Chair of the Association for Science Education (ASE) and editor of Maths Skills for Cambridge IGCSE® Biology, Chemistry and Physics workbooks and teacher guides.
Thank you for your feedback which will help us improve our service.
If you requested a response, we will make sure to get back to you shortly.
×